
DCPS Chancellor Kaya Henderson welcomed today the new graduation rate calculation released by the Office of the State Superintendent of Education (OSSE). The new calculation method, the Adjusted Cohort Graduation Rate (ACGR), is required by the US Department of Education.
DCPS Chancellor Kaya Henderson welcomed today the new graduation rate calculation released by the Office of the State Superintendent of Education (OSSE). The new calculation method, the Adjusted Cohort Graduation Rate (ACGR), is required by the US Department of Education.
According to ACGR, District of Columbia Public Schools’ graduation rate for 2011 is about 21 percentage points lower than the 2010 graduation rate, which was calculated using the former methodology. This new calculation puts the four-year DCPS graduation rate for the Class of 2011 at 52.99 percent. The state average graduation rate for 2011 is 58.56 percent.
“For years, we've known that our graduation rates did not accurately reflect our successes and our challenges with our high school students,” said Chancellor Kaya Henderson. “With the new calculations, we have a clearer understanding of the work we still need to do, and the public has a more reliable way to hold us accountable.”
The overall 2011 four-year graduation rate for traditional DCPS high schools is 61.1 percent, with 2,047 graduates and 1,304 non-graduates. Of that group, the four-year graduation rate for comprehensive high schools is 54.6 percent, with 1,454 graduates and 1,211 non-graduates; the four-year graduation rate for application schools is 86.4 percent, with 593 graduates and 93 non-graduates; and the four-year graduation rate for non-traditional schools is 13.9 percent, with 59 graduates and 365 non-graduates.
Comprehensive high schools include: Anacostia High School, Ballou High School, Cardozo High School, Coolidge High School, Dunbar High School, Eastern High School, Roosevelt High School, Spingarn High School, Wilson High School and H.D. Woodson High School.
Application high schools include: Banneker Senior High School, Columbia Heights Education Campus, Duke Ellington School of the Arts, McKinley Technology High School and School Without Walls Senior High School.
Non-traditional schools include: Ballou STAY, Roosevelt STAY, Spingarn STAY and Luke Moore Alternative High School and schools serving students with special needs.
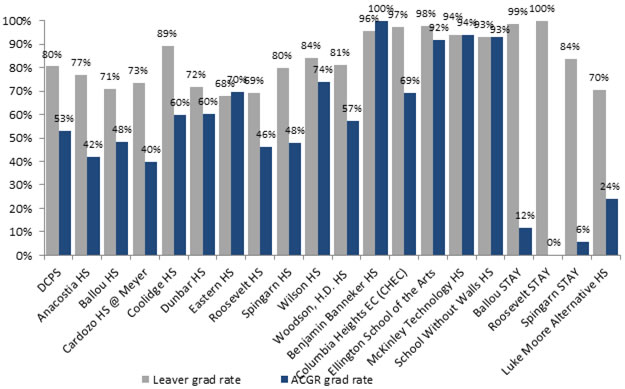
Under the ACGR, reported graduation rates are significantly lower in several DCPS high schools. Additionally, the graduation rate among different types of high schools varies widely. Part of the reason for this is that DCPS requires students who do not have enough credits to take a fifth year to graduate or earn credits through summer school and online credit recovery programs. These graduates are not included in the four-year graduation rate.
GRADUATION RATES FOR COMPREHENSIVE, APPLICATION, ALTERNATIVE AND ADULT HIGH SCHOOLS:
DCPS educates hundreds of adults in its STAY programs. Further, schools such as Luke C. Moore Academy serve disengaged youth ages 17–20 that may have dropped out of high school, have adjudication issues, or have had difficulties in traditional school settings.
Using the previous Leaver Rate, 2011 graduation rates at those DCPS schools are high: 98.69 percent at Ballou STAY (302 graduates, 4 dropouts); 83.67 percent at Spingarn STAY (82 graduates, 16 dropouts); 100 percent at Roosevelt STAY (108 graduates, 0 dropouts); and 70.24 percent at Luke C. Moore (118 graduates and 50 dropouts).
Under the new ACGR, reported graduation rates at those schools are significantly lower, as the ACGR follows a cohort of rising ninth graders who receive only a regular diploma within four years. These schools specialize in supporting student outcomes other than traditional four-year diplomas.
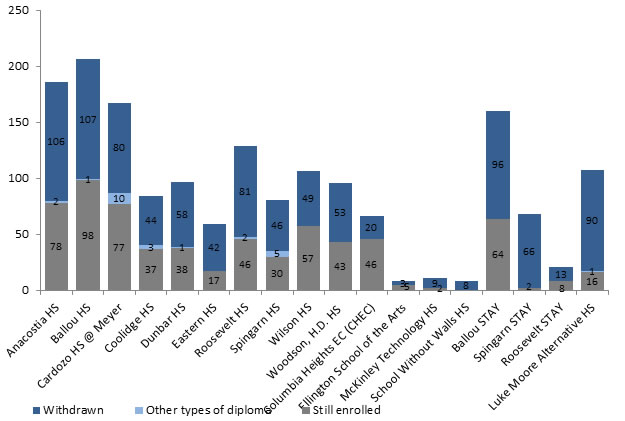
The chart below shows the number of non-graduates by school, including comprehensive, application and non-traditional schools.
The ACGR counts the total number of students who enter the ninth grade in a given year and follows these students for four years until graduation, subtracting students who transfer out and adding students who transfer into the system. The prior calculation, the Leaver Rate, differs from the ACGR in that it looks at the number of students who graduate in a given year and includes those students who may have required more than four years to graduate.
|
Adjusted Cohort Rate (New method) |
Leaver Rate (Prior method) |
|
|
|
|
|
|
|
Contact: Melissa Salmanowitz | 202-535-1096